Energy Consumption and Cost in Office Building (September 2014)
Consumption slightly down, price rise slowed, and cost is decreasing
Xymax Real Estate Institute has been studying the energy consumption and energy cost in office buildings in Japan and releasing the results on regular basis. The report covering January 2010 to June 2014 was released in September. This is an update report covering up to September 2014.
Monthly data (April 2009 – September 2014) is available at the end of this report.
Findings as of September 2014
Energy Consumption
17% lower than in 2010, slightly decreased from the continuous falls after the earthquake.
Energy Price per Unit
45% higher than in 2010, the uptrend started in mid-2010 slightly slowed.
Energy Cost
20% higher than in 2010, slightly decreased after a rise influenced by the changing trends of consumption and price per unit.
Figure : Energy Consumption, Price per Unit and Cost by 12-month Average
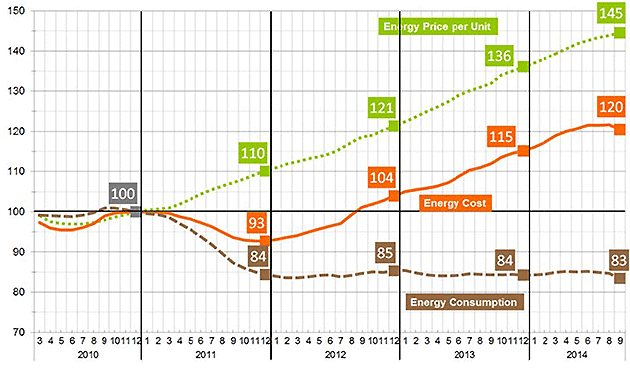
- ・The figures for each month are not based on the actual amount of a particular single month but are the average for the past 12 months.
- ・Indexed based on December 2010 = 100
- ・Energy consumption is converted to mega joule (MJ) (amount of primary energy)
- ・Consumption and cost are estimated based on per sqm and indexed.
- ・Relation among the three indexes: Cost = Price per Unit (MJ) × Consumption